


About Us
Our story
Skegs launched in 2014 to bring useful water sports information together in one place. The creator of Skegs, Steve Midgley, had grown weary of manually stitching different sources together to build up a picture of the local conditions. Being a keen sailor and windsurfer in the South of England, he found it was imperative to know not just the wind and weather forecasts but also what the tide would be doing.
At Skegs we understand that sailors, surfers and other water sports enthusiasts need to know about water conditions as much as the weather. The tide depth and surf conditions can be just as important as the wind, temperature and rain. So we draw on the best information sources available to present a comprehensive and easy-to-use forecast for users across the globe.
Since then we've seen a growing interest from our users in non-coastal forecasts and have expanded our coverage inland. We can provide forecasts for any location on the globe, so if you don't see a forecast yet then please tell us where your favourite spots are and we'll add them for you.
How to read our forecasts
We provide a 7-day forecast for each location that we cover. The times shown are local to that location and forecasts cover daylight hours only.

Note that while we've opted to use the generic term of rain, precipitation could also take the form of hail, sleet or snow. Please consider other factors such as temperature or whether your area is prone to thunder showers when planning your session.
Cloud cover indicates the percentage of the sky obscured by cloud. The lower the number, the sunnier it should be.
Rain indicates the volume of precipitation expected in a one-hour period. Although we have opted to use the generic term of "rain", precipitation could also take the form of hail, sleet or snow. Please consider other factors such as temperature or whether your area is prone to thunder showers when planning your session. Rainfall can be shown using millimeters or inches.
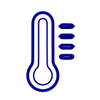 Temperature reflects the
air temperature and can be shown using either the celsius or Fahrenheit scales.
Temperature reflects the
air temperature and can be shown using either the celsius or Fahrenheit scales.
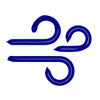 Wind forecasts indicate
the base wind, gust strength, and prevailing wind direction. Wind speeds can be shown in miles per hour
(mph), kilometers per hour (kph), knots (kts) or the
Beaufort scale (Bf).
Wind forecasts indicate
the base wind, gust strength, and prevailing wind direction. Wind speeds can be shown in miles per hour
(mph), kilometers per hour (kph), knots (kts) or the
Beaufort scale (Bf).
Wind and Gust indicate the speed and steadiness of the wind. Wind speeds can be shown in miles per hour (mph), kilometers per hour (kph), knots (kts) or the Beaufort scale (Bf).
Wind Direction indicates the bearing that the wind is blowing on. The arrow points in the direction that the wind is heading, while the text indicates the compass point it's blowing from. Wikipedia has a good page that explains wind direction conventions in more detail.
 Tide is an indication of the height of the tide at a point measured by
the hydrographic services. It should be read in conjunction with your experience of the local area
to determine how it reflects the minimium water needed for your equipment. You can find precise
times for highs and lows at the bottom of each day's forecast.
Tide is an indication of the height of the tide at a point measured by
the hydrographic services. It should be read in conjunction with your experience of the local area
to determine how it reflects the minimium water needed for your equipment. You can find precise
times for highs and lows at the bottom of each day's forecast.
The tide height is represented by a graph that shows the hydrographic depth for each hour, and is available only for UK coastal locations. Tide depth can be shown either in metric or imperial measures.
The direction of the tide is indicated by a graphic as follows:
| Tide depth is increasing (flood / tide coming in). | |
| Tide depth is decreasing (ebb / tide going out). | |
| The tide will reach a low ebb and start to come in (change from ebb to flood). | |
| The tide will peak and start to go out (change from flood to ebb). |
Tide depth can be shown either in meters or in feet and inches.
Occasionally, a change in tide direction can be followed by a depth that appears to go the wrong way. For example, you may see a symbol at 8am that says the tide will begin to come in, yet the depth at 9am is still lower. This occurs when the actual tide change happens late in the window, such as at 8:50. The symbol aligns with 8am for ease of reading, but the depth is lower at 9am as it is closer to the low water mark.
No tidal information is shown for inland locations.
The moon phase shows each day's stage of the 28-day lunar cycle. Full moon and new moon produce spring tides, which are stronger than the neap tides found during the first and last quarters. Spring tides bring higher highs, lower lows and a more pronounced flow. You can find a good explanation of the relationship between the moon and tides in Deborah Byrd's blog post on EarthSky. We indicate the moon phases as follows:
| New moon | First quarter | Full moon | Last quarter |
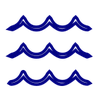
 Swell forecasts are available for many of our coastal locations and show the
height of marine waves along with the mean direction of travel and the time in seconds between swells.
The background colour's intensity indicates the swell height relative to the location's normal range.
Deeper colours mean bigger waves, while lighter colours predict flatter water.
Swell forecasts are available for many of our coastal locations and show the
height of marine waves along with the mean direction of travel and the time in seconds between swells.
The background colour's intensity indicates the swell height relative to the location's normal range.
Deeper colours mean bigger waves, while lighter colours predict flatter water.
 Barometric Pressure gives the level of atmospheric pressure - the gravitational
force of the air. It's a crude indicator of whether conditions are stable or changeable, and what matters
is the rate and direction of change. Generally, stormy conditions are associated with rapidly falling air
pressure, while high steady values indicate clear skies with light winds.
Barometric Pressure gives the level of atmospheric pressure - the gravitational
force of the air. It's a crude indicator of whether conditions are stable or changeable, and what matters
is the rate and direction of change. Generally, stormy conditions are associated with rapidly falling air
pressure, while high steady values indicate clear skies with light winds.
The Overnight Summary is intended to give a sense of how the weather may affect conditions between the daily forecasts. For example, stormy winds overnight can whip up swell and chop that wouldn't otherwise be evident if the storm passes before daybreak. The wind factors shown are the minimum wind and maximum gusts. Temperature is the overnight low. Rainfall is the total forecast for the period.
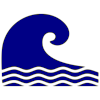
Water temperature is a measure of the water surface temperature. We use the most recent 24-hours buoy and ship data combined with satellite geothermal imaging to provide the current average temperature value for each location.
A note about forecast accuracy
Weather forecasters use a variety of instrumentation and data as a basis for constructing their forecasts. They then apply models to this data to provide a picture of what the weather is likely to do over a period of time. In most cases, short-term forecasts (up to two days) tend to be more accurate than longer-term ones. Of course our forecasters don't control the weather, they simply try to read it. Sometimes they get it wrong due to other factors coming in to play that were not, or could not, be considered.
Tide predictions tend to be more reliable than weather forecasts as they're based primarily on the position of the moon, sun and Earth in relation to one another. These are stable factors that combine with the shape of the ocean basins and the swirl caused by Earth's rotation. So, for any coastal location on the planet, it's possible to predict with some degree of certainty when the tide will change direction and what the mean water depth will be at that point. There's still a degree of modelling needed to provide predictions between the high- and low-water marks, and geographical factors such as narrow channels and river run-off may also influence the depth and strength of flow.
While we endeavour to provide you with the most accurate forecasts available, they are intended for recreational use only. Please take sensible precautions before going afloat and consider how you may respond should conditions not turn out as expected.
What are skegs anyway?
Wikipedia defines a skeg as an extension of the keel on boats that have a rudder mounted on the centre line. The extension is sternward, or towards the rear, and helps improve directional stability. The term is also used for a fin on a surfboard, windsurfer or kiteboard, or for a moveable fin on a kayak that adjusts the boat's centre of lateral resistance. Simply put, it's a word associated with a wide range of water-going craft, which happens to be our thing.
The word originates in the Scandinavian word for beard ("skegg" in Old Norse) and is related to the English "shaggy". It also appears in the English place name Skegness - "beard point" - from the way in which a series of sand spits forms towards the nearby Gibraltar Point. The English pronunciation reflects a probable Danish origin.
Privacy Statement
We use cookies to personalise your experience of our site. Stats are recorded anonymously to help us analyse usage and drive improvements in the Skegs service. We don't collect any personal details or information that would allow our visitors to be identified as individuals.
Cookies we create are used to capture user settings, preferences, forecasts and favourites set by our visitors. We process this information anonymously to provide customised forecasts and also to track trends in visitor activity.
We don't sell any of the information we collect, nor do we disclose it to third parties except where required by law (for example to government bodies and law enforcement agencies). Our social media, advertising and analytics partners may also collect information about your use of our site - you can read about their privacy policies here:
Credit where it's due
Tide data is reproduced by permission of the Controller of Her Majesty's Stationery Office and the UK Hydrographic Office (www.ukho.gov.uk). © Crown Copyright and/or database rights.
Printer icon courtesy of Anna Shlyapnikova